
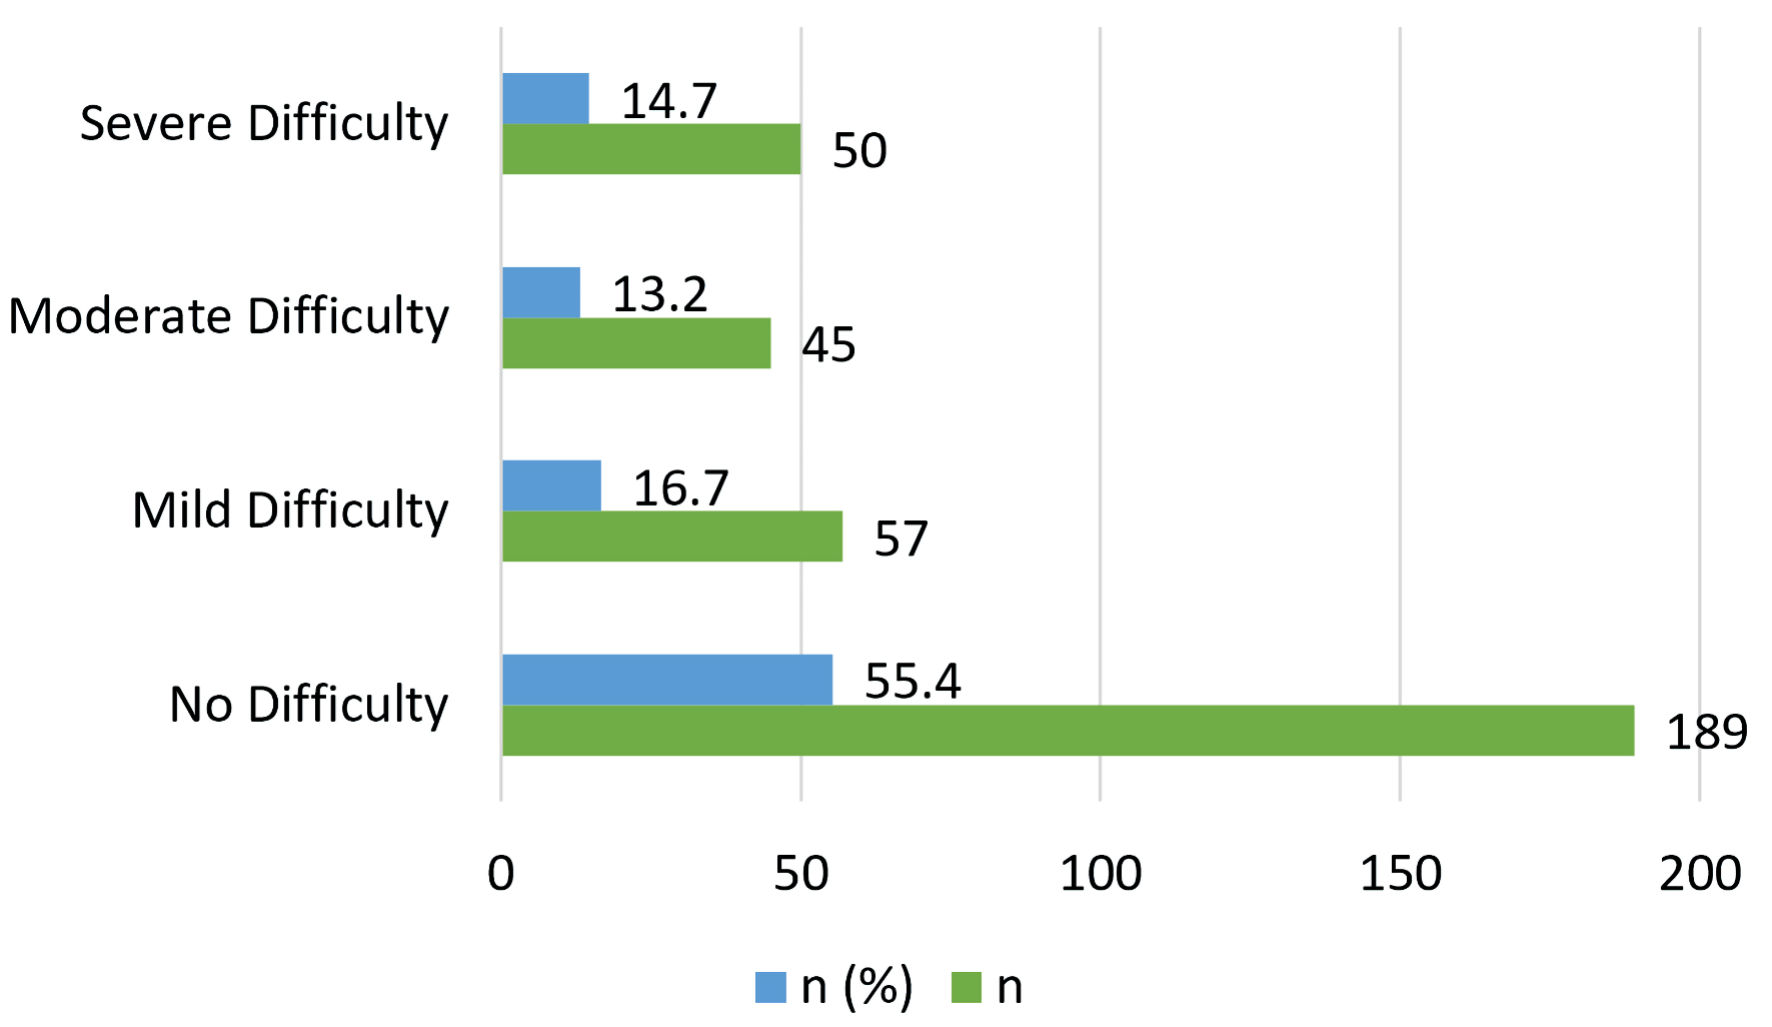
Figure 1. Feeding difficulty classification among patients (BAMBI, n = 341). BAMBI: Brief Autism Mealtime Behavior Inventory.
| International Journal of Clinical Pediatrics, ISSN 1927-1255 print, 1927-1263 online, Open Access |
| Article copyright, the authors; Journal compilation copyright, Int J Clin Pediatr and Elmer Press Inc |
| Journal website https://www.theijcp.org |
Original Article
Volume 13, Number 3, December 2024, pages 73-85
Feeding Behaviors Among Children With Autism Spectrum Disorder
Figures
Tables
| Characteristics | N (%) |
|---|---|
| Y: year; M: month; SCI: social communication interaction; RRB: repetitive, restricting behavior; BMI: body mass index; RM: Malaysian ringgit. | |
| Age | |
| 1Y - 1Y 11M | 1 (0.3%) |
| 2Y - 2Y 11M | 48 (14.1%) |
| 3Y - 3Y 11M | 56 (16.4%) |
| 4Y - 4Y 11M | 65 (19.1%) |
| 5Y - 5Y 11M | 65 (19.1%) |
| 6Y - 6Y 11M | 106 (31.1%) |
| Gender | |
| Male | 241 (70.7%) |
| Female | 100 (29.3%) |
| Ethnicity | |
| Malay | 229 (67.2%) |
| Chinese | 57 (16.7%) |
| Indian | 55 (16.1%) |
| BMI categories by percentile | |
| Underweight | 86 (25.2%) |
| Normal | 197 (57.8%) |
| Overweight | 27 (7.9%) |
| Obese | 31 (9.1%) |
| SCI | |
| 1 | 29 (8.5%) |
| 2 | 266 (78.0%) |
| 3 | 46 (13.5%) |
| RRB | |
| 1 | 152 (44.6%) |
| 2 | 185 (54.3%) |
| 3 | 4 (1.2%) |
| Paternal age category | |
| 20 - 30 years | 42 (12.3%) |
| 31 - 40 years | 231 (67.7%) |
| 41 - 50 years | 62 (18.2%) |
| More than 50 years | 6 (1.8%) |
| Father’s education | |
| Primary education | 3 (0.9%) |
| Secondary education | 94 (27.6%) |
| Diploma | 80 (23.5%) |
| Bachelor’s degree | 129 (37.8%) |
| Master’s degree | 35 (10.3%) |
| Maternal age category | |
| 20 - 30 years | 46 (13.5%) |
| 31 - 40 years | 248 (72.7%) |
| 41 - 50 years | 44 (12.9%) |
| More than 50 years | 3 (0.9%) |
| Mother’s education | |
| Primary education | 3 (0.9%) |
| Secondary education | 76 (22.3%) |
| Diploma | 96 (28.2%) |
| Bachelor’s degree | 132 (38.7%) |
| Master’s degree | 34 (10.0%) |
| Total monthly income | |
| Less than RM 3,000 | 24 (7.0%) |
| RM 3,000 - 5,000 | 83 (24.3%) |
| RM 5,000 - 10,000 | 126 (37.0%) |
| RM 10,000 - 15,000 | 85 (24.9%) |
| RM 15,000 - 20,000 | 11 (3.2%) |
| More than RM 20,000 | 12 (3.5%) |
| Relationship of respondent | |
| Parent | 243 (71.3%) |
| Other relative | 96 (28.2%) |
| Caregiver | 2 (0.6%) |
| Studies | This study | Kang et al [11] | Gray et al [19] | Lukens et al [15] | Lukens et al [15] |
|---|---|---|---|---|---|
| Values are presented as means (SD). Significance was denoted as *P < 0.05 and **P < 0.01. Differences were assessed with two-sample t-test for BAMBI scores compared between groups. BAMBI: Brief Autism Mealtime Behavior Inventory; SD: standard deviation; ASD: autism spectrum disorder. | |||||
| N | 341 | 64 | 31 | 68 | 40 |
| Age | 1 - 6 years 11 months | 1 - 7 years | 3 - 12 years | 3 - 11 years | 3 - 11 years |
| Race | Malaysian (current study) | Asian (Singapore) | Chinese American | Predominantly White American | Predominantly White American |
| Developmental condition | ASD | ASD | ASD | ASD | Typical developing |
| Total score | 41.46 (11.62) | 40.8 (9.1) | 43.59 (11.91) | 49.05 (10.33)** | 32.50 (8.59)** |
| Limited variety | 22.36 (6.68) | 20.7 (5.3) | 23.17 (6.61) | 27.61 (6.79)** | 17.83 (5.65)** |
| Food refusal | 9.49 (4.12) | 11.2 (3.3) | 9.33 (3.63) | 10.36 (3.74) | 6.93 (2.77)** |
| Features of autism | 9.61 (3.53) | 8.8 (3.4) | 11.09 (3.44)* | 11.07 (3.49)** | 7.75 (1.66)* |
| Item | This study (mean ± SD) | Benjasunwatep et al [18] (mean ± SD) | Ramsay et al [1] (mean ± SD) | van Dijk [9] (mean ± SD) |
|---|---|---|---|---|
| SD: standard deviation; MCH-FS: Montreal Children’s Hospital Feeding Scale. | ||||
| Population | Malaysian clinical sample (1 - 6 years 11 months) | Thai children (1 - 4 years) | Canadian clinical sample (6 months - 6 years 11 months) | Dutch clinical sample (1 - 6 years) |
| N | 341 | 200 | 174 | 80 |
| M1 | 3.20 ± 1.70 | 2.65 ± 1.84 | 5.30 ± 1.53 | 3.99 (1.47) |
| M2 | 3.76 ± 2.00 | 2.94 ± 2.03 | 5.49 ± 1.59 | 2.67 (1.72) |
| M3 | 2.91 ± 1.48 | 2.68 ± 1.68 | 4.60 ± 1.51 | 3.47 (1.29) |
| M4 | 4.02 ± 2.32 | 2.75 ± 1.80 | 5.42 ± 1.67 | 4.90 (2.06) |
| M5 | 2.83 ± 1.27 | 2.25 ± 1.75 | 3.57 ± 1.84 | 2.44 (1.30) |
| M6 | 3.07 ± 1.68 | 2.63 ± 1.65 | 4.60 ± 1.80 | 3.15 (1.47) |
| M7 | 2.88 ± 1.63 | 2.32 ± 1.70 | 4.02 ± 2.04 | 2.66 (1.87) |
| M8 | 2.78 ± 1.96 | 2.62 ± 1.97 | 3.55 ± 2.08 | 2.45 (1.80) |
| M9 | 3.54 ± 2.13 | 3.30 ± 2.10 | 4.91 ± 2.16 | 3.10 (1.65) |
| M10 | 3.17 ± 1.93 | 2.64 ± 1.88 | 4.64 ± 2.04 | 2.84 (1.65) |
| M11 | 2.43 ± 1.82 | 1.49 ± 1.09 | 3.32 ± 2.09 | 3.31 (1.67) |
| M12 | 2.94 ± 1.76 | 2.15 ± 1.54 | 4.14 ± 2.05 | 2.45 (1.92) |
| M13 | 2.88 ± 1.85 | 1.87 ± 1.43 | 3.37 ± 1.89 | 2.10 (1.44) |
| M14 | 2.91 ± 1.85 | 1.76 ± 1.46 | 3.56 ± 1.99 | 2.50 (1.78) |
| Total | 43.32 ± 14.74 | 34.01 ± 13.65 | 60.48 ± 13.04 | 39.96 (12.52) |
| SCI | No feeding difficulty (raw score < 34) | Feeding difficulty (raw score 34 and above) | Total |
|---|---|---|---|
| Chi-square tests: Pearson Chi-square: 0.520, df = 2, P = 0.771; Fisher’s exact test: P = 0.802. BAMBI: Brief Autism Mealtime Behavior Inventory; SCI: social communication interaction. | |||
| 1 | 7 (24.1%) | 22 (75.9%) | 29 |
| 2 | 75 (28.2%) | 191 (71.8%) | 266 |
| 3 | 11 (23.9%) | 35 (76.1%) | 46 |
| Total | 93 (27.3%) | 248 (72.7%) | 341 |
| RRB | No feeding difficulty (raw score < 34) | Feeding difficulty (raw score 34 and above) | Total |
|---|---|---|---|
| Chi-square tests: Pearson Chi-square: 6.470, df = 2, P = 0.039; Fisher’s exact test: P = 0.040. BAMBI: Brief Autism Mealtime Behavior Inventory; RRB: repetitive, restrictive behavior. | |||
| 1 | 51 (33.6%) | 101 (66.4%) | 152 |
| 2 | 42 (22.7%) | 143 (77.3%) | 185 |
| 3 | 0 (0.0%) | 4 (100.0%) | 4 |
| Total | 93 (27.3%) | 248 (72.7%) | 341 |
| SCI | Not having difficulty raw score 45 and below | Having difficulty raw score > 45 | Total |
|---|---|---|---|
| Chi-Square tests: Pearson Chi-square: 0.571, df = 2, P = 0.752; Fisher’s exact test: P = 0.789. SCI: social communication interaction; MCH-FS: Montreal Children’s Hospital Feeding Scale. | |||
| 1 | 18 (62.1%) | 11 (37.9%) | 29 |
| 2 | 146 (54.9%) | 120 (45.1%) | 266 |
| 3 | 25 (54.3%) | 21 (45.7%) | 46 |
| Total | 189 (55.4%) | 152 (44.6%) | 341 |
| RRB | Not having difficulty raw score 45 and below | Having difficulty raw score > 45 | Total |
|---|---|---|---|
| Chi-square tests results: Pearson Chi-square: value = 6.568, df = 2, P = 0.037; Fisher’s exact test: P = 0.026. Two cells (33.3%) have an expected count less than 5, which influences the test’s validity, and it is likely why Fisher’s exact test is also presented. RRB: repetitive, restrictive behavior; MCH-FS: Montreal Children’s Hospital Feeding Scale. | |||
| 1 | 95 (62.5%) | 57 (37.5%) | 152 |
| 2 | 93 (50.3%) | 92 (49.7%) | 185 |
| 3 | 1 (25.0%) | 3 (75.0%) | 4 |
| Total | 189 (55.4%) | 152 (44.6%) | 341 |
| Factor/domain | Normal and underweight (n = 283), median (IQR) | Overweight and obese (n = 58), median (IQR) | P value |
|---|---|---|---|
| Median values are accompanied by the IQR in parentheses. P values are derived from the Mann-Whitney U test comparing the normal and underweight group with the overweight and obese group across various factors and domains. Statistically significant differences (P < 0.05) are noted. IQR: interquartile range. BAMBI: Brief Autism Mealtime Behavior Inventory; ASD: autism spectrum disorder; MCH-FS: Montreal Children’s Hospital Feeding Scale. | |||
| BAMBI and domains | |||
| BAMBI total score | 40.00 (16) | 43.00 (15) | 0.034 |
| 1) Limited variety | 22.00 (11) | 25.50 (9) | 0.003 |
| 2) Food refusal | 8.00 (6) | 8.50 (5) | 0.844 |
| 3) Features of autism | 9.00 (5) | 10.00 (5) | 0.343 |
| MCH and domains | |||
| MCH total score | 43.00 (21) | 38.00 (24) | 0.072 |
| 1) Parental concern | 10.00 (6) | 7.50 (8) | 0.007 |
| 2) Family reaction | 6.00 (6) | 4.00 (6) | 0.149 |
| 3) Compensatory strategy | 10.00 (6) | 8.00 (6) | 0.018 |
| 4) Appetite | 7.00 (4) | 8.00 (5) | 0.871 |
| 5) Mealtime behavior | 6.00 (5) | 6.00 (5) | 0.679 |
| 6) Oral sensory | 6.00 (5) | 6.00 (5) | 0.594 |
| 7) Oral motor | 5.00 (6) | 4.50 (6) | 0.918 |
| Feeding difficulty classification (BAMBI) vs. (MCH) | Reported no feeding difficulty (raw score < 45) | Reported having difficulty (raw score > 45) | Total |
|---|---|---|---|
| BAMBI: Brief Autism Mealtime Behavior Inventory; MCH-FS: Montreal Children’s Hospital Feeding Scale. | |||
| Reported no feeding difficulty (raw score < 34) | 83 (43.9%) | 10 (6.6%) | 93 (27.3%) |
| Reported feeding difficulty (raw score > 34) | 106 (56.1%) | 142 (93.4%) | 248 (72.7%) |
| Total | 189 (100.0%) | 152 (100.0%) | 341 (100.0%) |