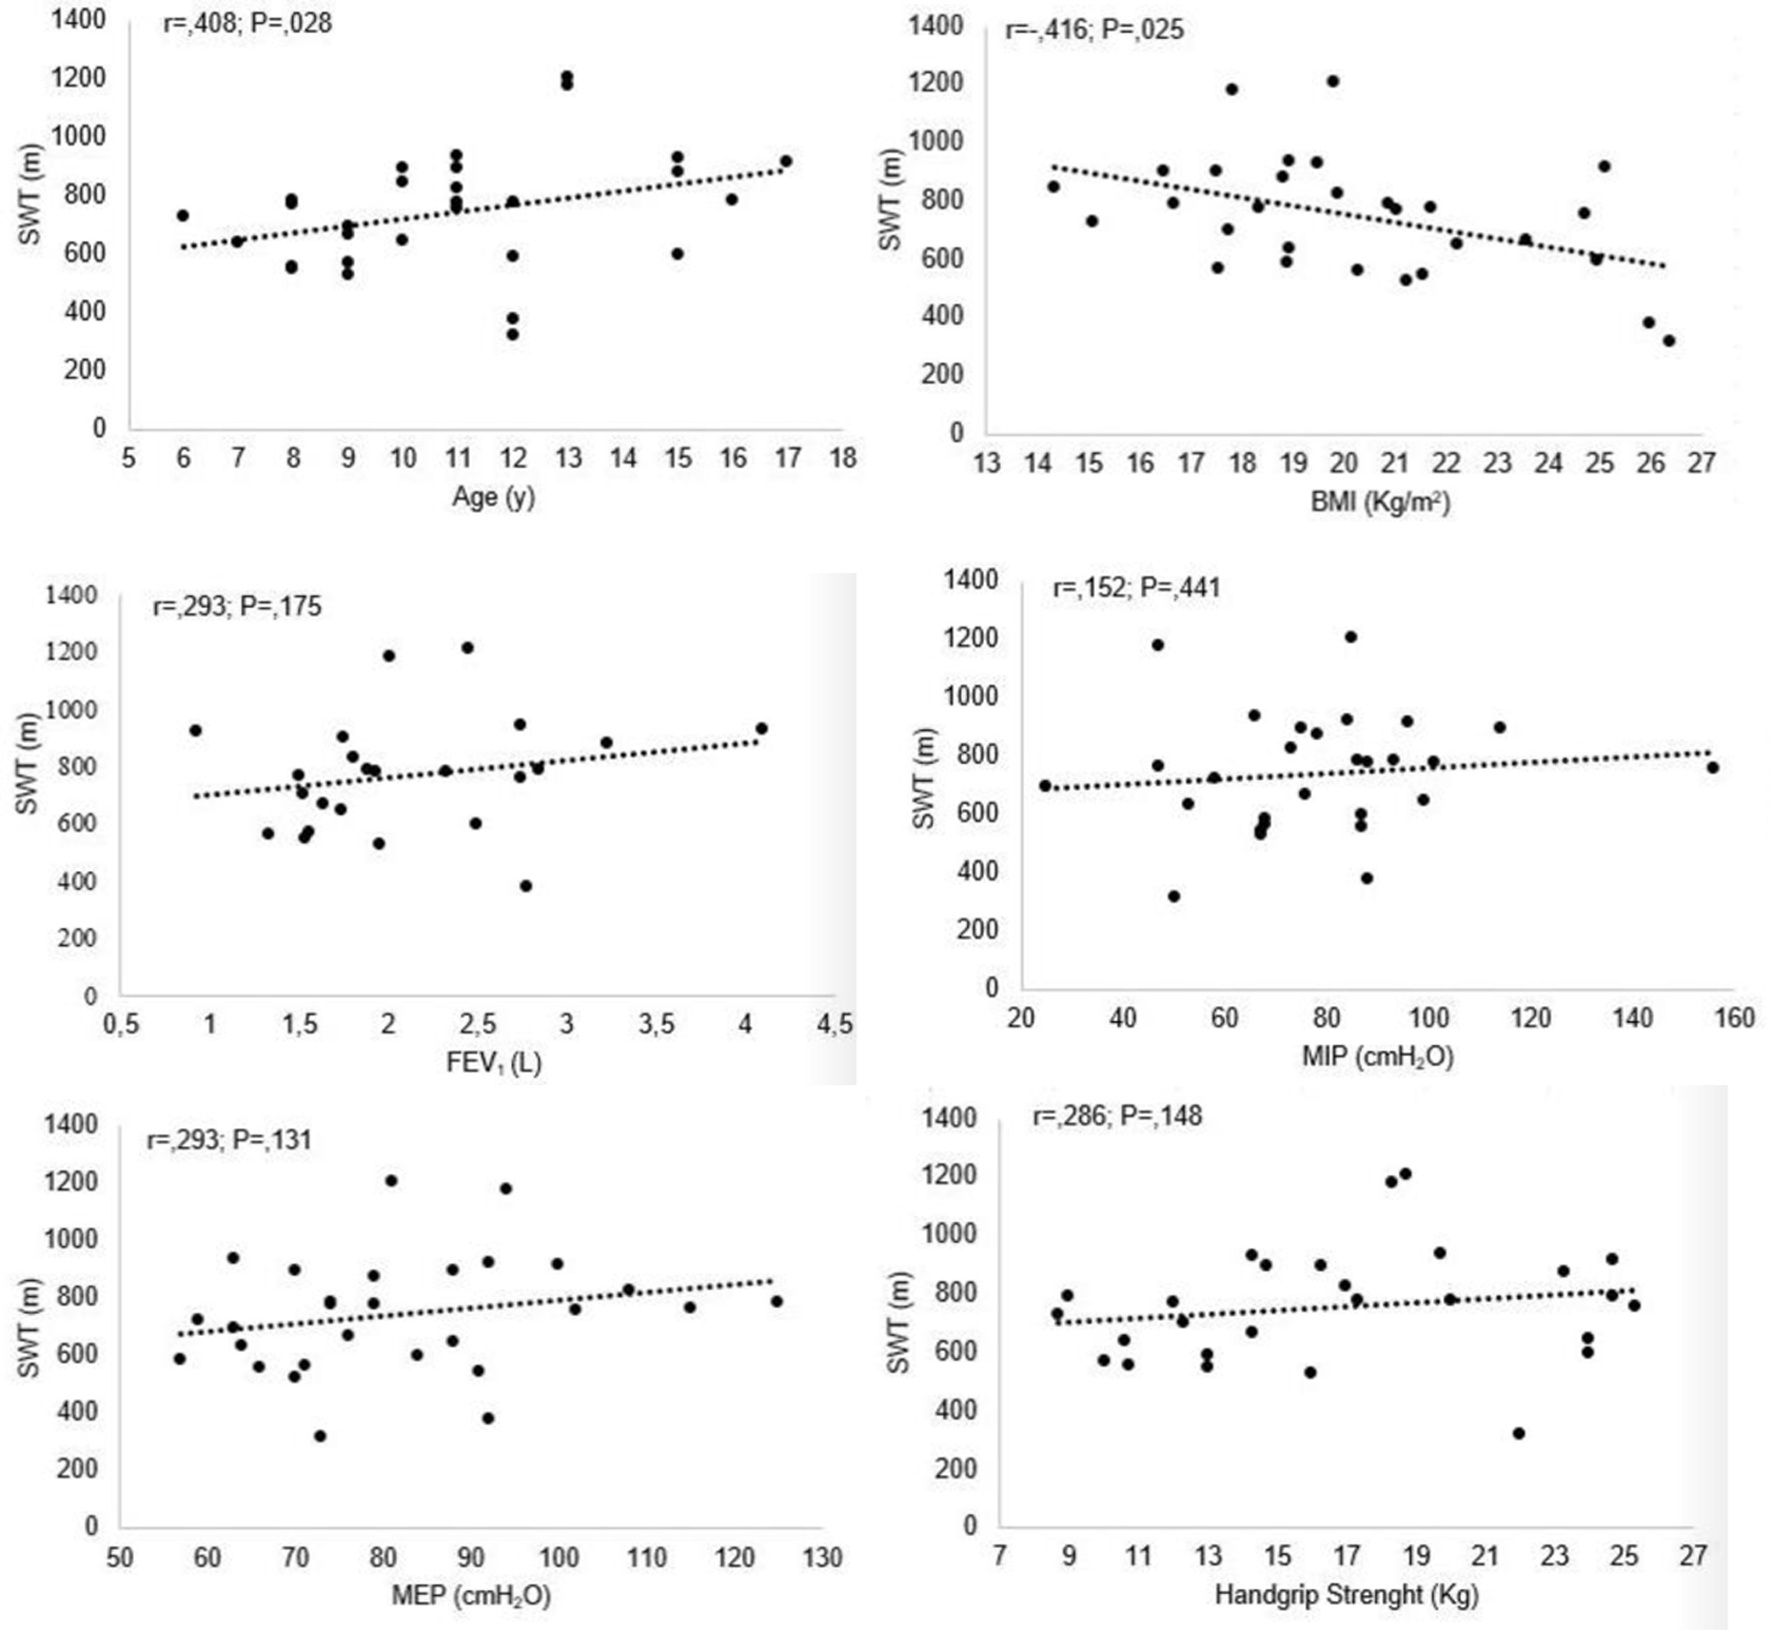
Figure 1. Correlation between MST and age, BMI, pulmonary function test, respiratory and peripheral muscle strength. MEP: maximal expiratory pressure; MIP: maximal inspiratory pressure; MST: modified shuttle test; BMI: body mass index.
| International Journal of Clinical Pediatrics, ISSN 1927-1255 print, 1927-1263 online, Open Access |
| Article copyright, the authors; Journal compilation copyright, Int J Clin Pediatr and Elmer Press Inc |
| Journal website https://www.theijcp.org |
Original Article
Volume 11, Number 3, October 2022, pages 76-84
Reduction of Exercise Capacity, Respiratory and Peripheral Muscle Strength in Severe Asthma
Figures
Tables
| Variables | N = 30 |
|---|---|
| Data are presented as mean ± SD or n (%). an = 23; bn = 17; c≥ 12 years, n = 11. BMI: body mass index; FEF25-75: forced expiratory flow at 25-75% of FVC; FEV1: forced expiratory volume at first second of FVC; FVC: forced vital capacity; PEF: peak expiratory flow; IPAQ: International Physical Activity Questionnaire; PedsQL: Pediatric Quality of Life Inventory Asthma Module. | |
| Female | 19 (63.3) |
| Age, years | 10.8 ± 2.88 |
| Anthropometry | |
| Weight, kg | 42.8 ± 1.44 |
| Height, m | 1.44 ± 0.15 |
| Height, z score | -0.03 ± 1.37 |
| BMI, kg/m2 | 20.34 ± 3.22 |
| BMI, z score | 0.99 ± 1.20 |
| Lung function | |
| FVC, L (%)a | 2.4 ± 0.8 (104.0 ± 10.6) |
| FEV1, L (%)a | 2.1 ± 0.7 (101.5 ± 13.5) |
| FEV1/FVCa | 87.7 ± 8.3 |
| FEF25-75, L (%)b | 2.5 ± 1.1 (100.8 ± 37.4) |
| PEF, L (%)b | 5.7 ± 2.2 (104.9 ± 18.5) |
| Physical activity (IPAQ)c | |
| Very active | 0 (0.0) |
| Active | 6 (54.5) |
| Insufficiently active A | 4 (36.4) |
| Insufficiently active B | 1 (9.1) |
| Sedentary | 0 (0.0) |
| Quality of life (PedsQL asthma) | |
| Asthma symptoms | 69.7 ± 18.0 |
| Treatment problems | 84.3 ± 13.3 |
| Worry | 70.8 ± 25.6 |
| Communication | 83.1 ± 16.1 |
| Test | Obtained | Predict | % of predict | P value |
|---|---|---|---|---|
| aPredicted by reference equation. bPredicted by normative values. Data are presented as mean ± SD. 6MWT: 6-min walk test; HS: handgrip strength; MEP: maximal expiratory pressure; MIP: maximal inspiratory pressure; MST: modified shuttle test; PedsQL: Pediatric Quality of Life Inventory Asthma Module. | ||||
| 6MWT (m) | 538.0 ± 63.7 | 640.0 ± 44.1 | 84.4 ± 11.3a | < 0.001 |
| MST (m) | 748.3 ± 201.4 | 918.2 ± 134.2 | 81.5 ± 18.1a | < 0.001 |
| MIP (cm H2O) | 77.9 ± 24.8 | 93.4 ± 10.6 | 83.4 ± 24.6a | 0.002 |
| MEP (cm H2O) | 82.1 ± 17.2 | 98.4 ± 7.8 | 83.9 ± 18.2a | < 0.001 |
| HS (kg) | 16.5 ± 5.4 | 19.1 ± 6.2 | 88.8 ± 19.3b | 0.003 |
| Variables | Asthma symptoms | Treatment problems | Worry | Communication | ||||
|---|---|---|---|---|---|---|---|---|
| r | P | r | P | r | P | r | P | |
| 6MWT: 6-min walk test; BMI: body mass index; HS: handgrip strength; MEP: maximal expiratory pressure; MIP: maximal inspiratory pressure; MST: modified shuttle test; PedsQL: Pediatric Quality of Life Inventory Asthma Module. | ||||||||
| Age | -0.403 | 0.027 | -0.262 | 0.162 | -0.599 | < 0.001 | -0.284 | 0.136 |
| BMI | -0.390 | 0.033 | -0.170 | 0.370 | -0.138 | 0.467 | -0.243 | 0.204 |
| MST | 0.059 | 0.762 | -0.060 | 0.758 | -0.165 | 0.392 | 0.134 | 0.496 |
| 6MWT | -0.018 | 0.926 | -0.047 | 0.805 | 0.076 | 0.691 | 0.177 | 0.359 |
| MIP | 0.141 | 0.474 | 0.047 | 0.813 | -0.127 | 0.519 | -0.340 | 0.083 |
| MEP | -0.338 | 0.078 | -0.398 | 0.036 | -0.249 | 0.202 | -0.053 | 0.794 |
| HS | -0.522 | 0.004 | -0.287 | 0.139 | -0.504 | 0.006 | -0.308 | 0.118 |