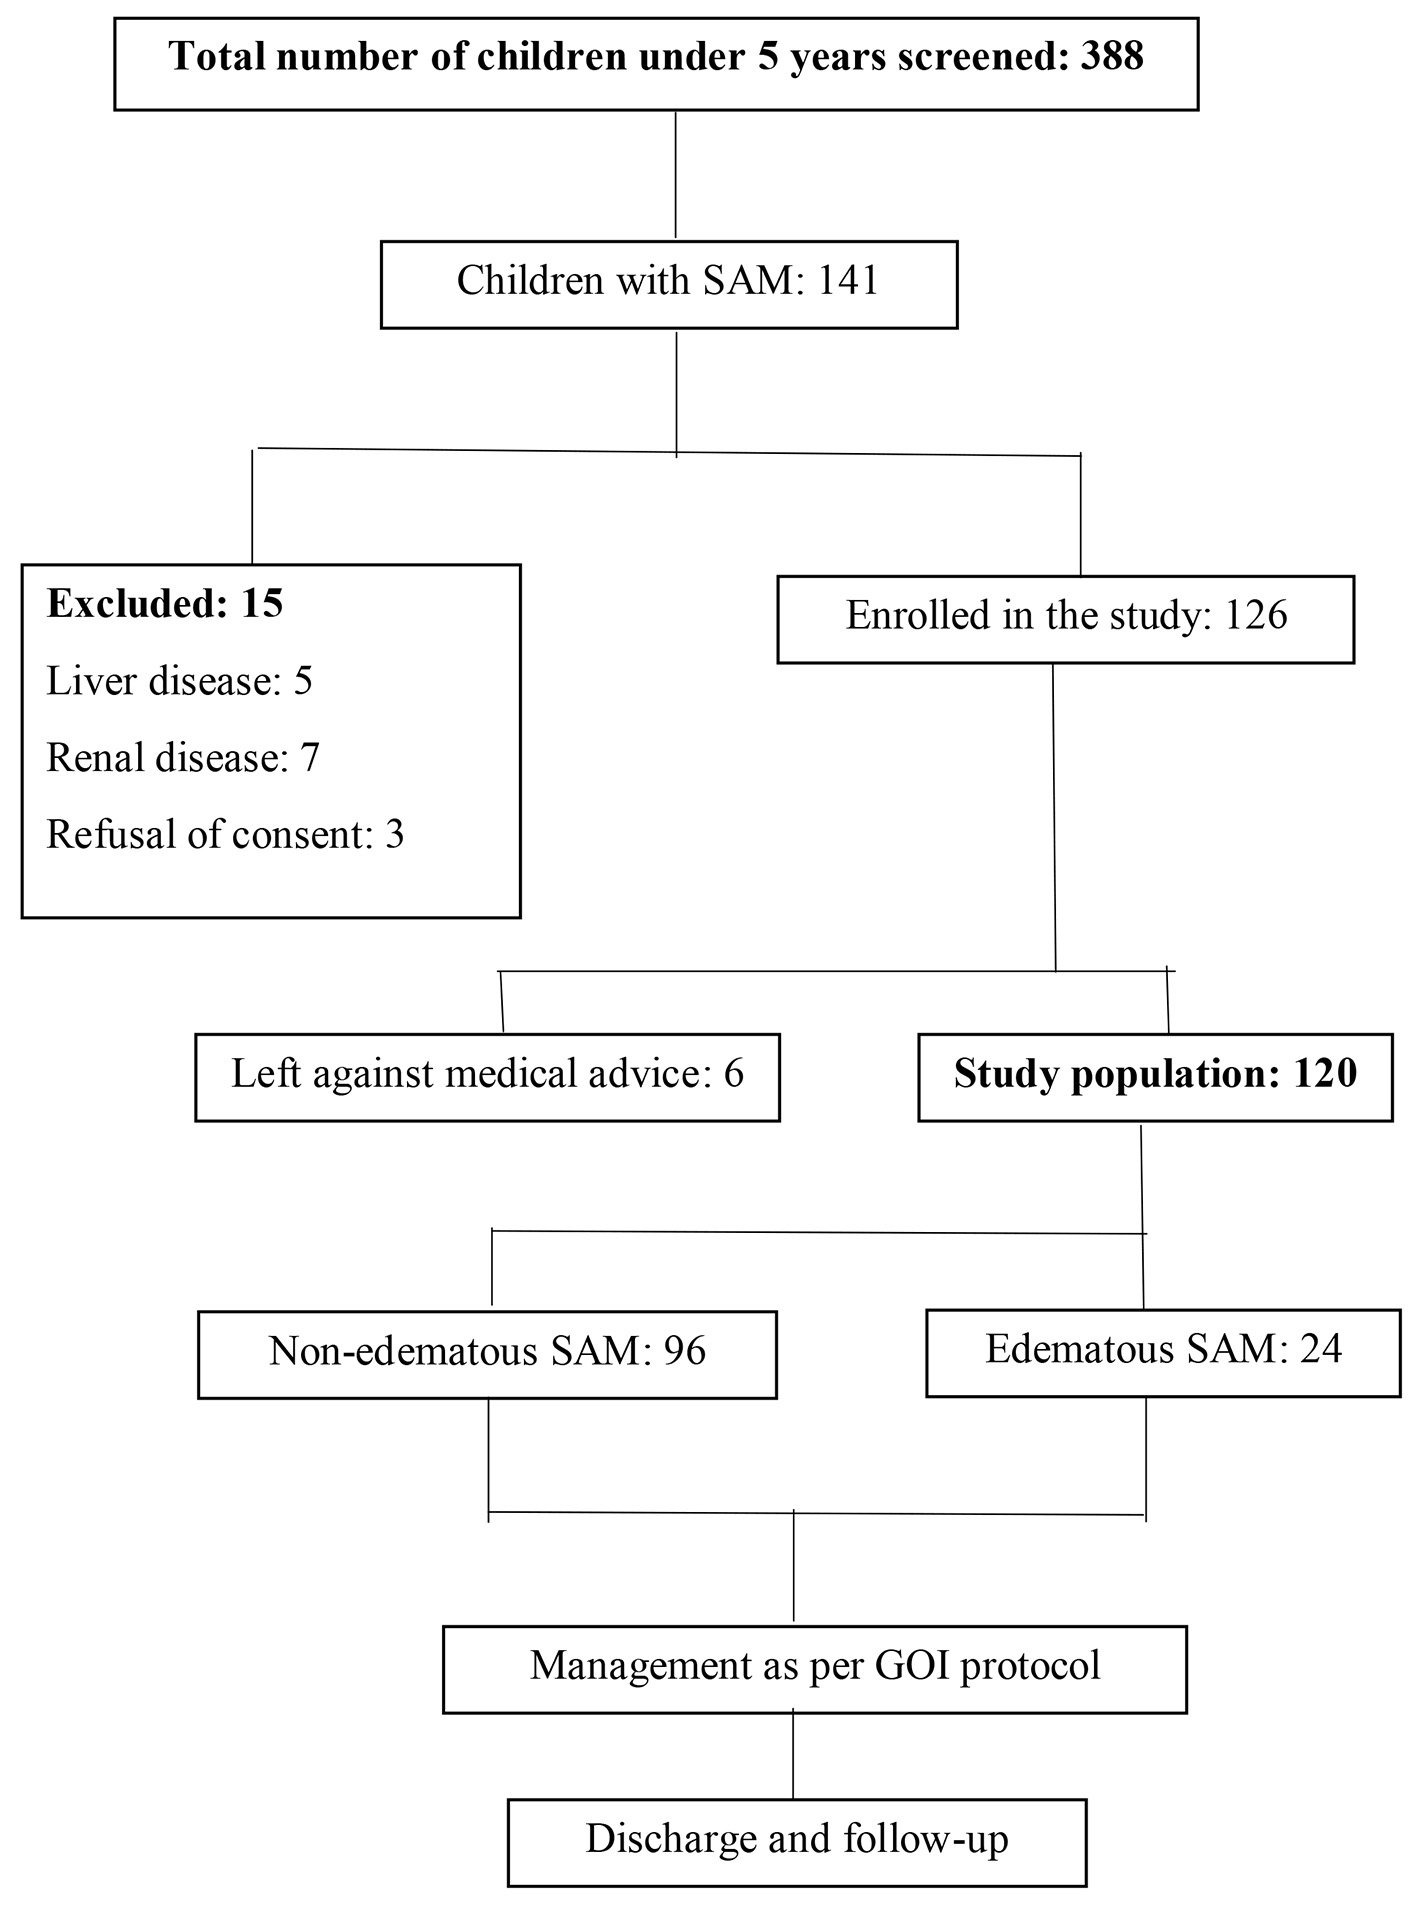
Figure 1. Schematic representation of enrolment of subjects. SAM: severe acute malnutrition.
| International Journal of Clinical Pediatrics, ISSN 1927-1255 print, 1927-1263 online, Open Access |
| Article copyright, the authors; Journal compilation copyright, Int J Clin Pediatr and Elmer Press Inc |
| Journal website https://www.theijcp.org |
Original Article
Volume 10, Number 2-3, September 2021, pages 35-42
Serum Phosphate Profile of Children With Severe Acute Malnutrition Treated With Locally Prepared Therapeutic Feeds: A Prospective Observational Study
Figures
Tables
| Variables | N (%) |
|---|---|
| Age group | |
| 6 - 23 months | 102 (85.0) |
| 24 - 59 months | 18 (15.0) |
| Sex | |
| Male | 55 (45.8) |
| Female | 65 (54.2) |
| Clinical profile on admission | |
| Not growing well (parental perception) | 19 (15.8) |
| Diarrhea/vomiting | 56 (46.7) |
| Cough/difficulty in breathing | 28 (23.4) |
| Fever | 7 (5.8) |
| Other comorbid conditions | |
| Anemia | 85 (70.8) |
| Rickets | 38 (31.7) |
| Celiac disease | 4 (3.3) |
| Hypothyroidism | 1 (0.8) |
| Variables | On admission, mean (SD) | At discharge, mean (SD) | t-statistics/Chi-square statistics, P-value |
|---|---|---|---|
| WAZ: weight-for-age z-score; HAZ: height-for-age z-score; WHZ: weight-for-height z-score; MUAC: mid-upper arm circumference; SD: standard deviation. | |||
| Weight (g) | 6,146.17 (1,409.83) | 6,395.42 (1,413.51) | t-statistics = 9.30, P < 0.001 |
| WAZ | -4.18 (1.16) | -3.74 (1.02) | t-statistics = 10.69, P < 0.001 |
| HAZ | -2.91 (1.38) | -2.82 (1.30) | t-statistics = 4.00, P < 0.001 |
| WHZ | -3.96 (1.10) | -3.48 (1.00) | t-statistics = 10.92, P < 0.001 |
| MUAC (mm) | 108.02 (9.43) | 110.75 (8.29) | t-statistics = 7.63, P < 0.001 |
| WHZ < -3 | 103 (85.80) | 82 (68.30) | Chi-square statistics = 10.35, P = 0.001 |
| MUAC < 115 mm | 92 (76.70) | 83 (69.20) | Chi-square statistics = 1.70, P = 0.19 |
| Bilateral pitting edema | 24 (20.0) | 0 (0.00) | Chi-square statistics = 26.56, P < 0.001 |
| Phosphate profile | Admission, N (%) | Transition, N (%) | Discharge, N (%) |
|---|---|---|---|
| Normophosphatemia | 86 (71.7) | 86 (71.7) | 97 (80.8) |
| Hypophosphatemia | 30 (25.0) | 28 (23.3) | 10 (8.3) |
| Hyperphosphatemia | 4 (3.3) | 6 (5.0) | 13 (10.8) |
| Total | 120 (100.0) | 120 (100.0) | 120 (100.0) |
| Mean serum phosphate | Clinical characteristics on admission | Status | Mean (SD), mg/dL | P value* |
|---|---|---|---|---|
| *Unpaired t-test. SD: standard deviation. | ||||
| Admission | Diarrhea | Yes | 4.32 (1.07) | 0.569 |
| No | 4.43 (1.06) | |||
| Transition | Yes | 4.51 (1.34) | 0.772 | |
| No | 4.44 (0.98) | |||
| Discharge | Yes | 5.19 (1.10) | 0.569 | |
| No | 5.07 (1.09) | |||
| Admission | Dehydration | Yes | 4.42 (1.06) | 0.693 |
| No | 4.34 (1.08) | |||
| Transition | Yes | 4.45 (1.30) | 0.891 | |
| No | 4.48 (1.08) | |||
| Discharge | Yes | 5.2 (1.22) | 0.578 | |
| No | 5.09 (1.02) | |||
| Admission | Edema | Yes | 4.31 (1.11) | 0.713 |
| No | 4.39 (1.06) | |||
| Transition | Yes | 4.21 (1.16) | 0.211 | |
| No | 4.54 (1.16) | |||
| Discharge | Yes | 4.79 (1.13) | 0.089 | |
| No | 5.22 (1.08) | |||
| Edema on admission | Hypophosphatemia | Normophosphatemia | Hyperphosphatemia | P value* | |
|---|---|---|---|---|---|
| *Chi-square test. | |||||
| Admission | Yes | 8 (33.33%) | 16 (66.67%) | 0 (0%) | 0.379 |
| No | 22 (22.90%) | 70 (72.70%) | 4 (4.2%) | ||
| Transition | Yes | 11 (45.82%) | 12 (50%) | 1 (4.2%) | 0.014 |
| No | 17 (17.7%) | 74 (77%) | 5 (5.30%) | ||
| Discharge | Yes | 5 (20.8%) | 16 (66.67%) | 3 (13%) | 0.040 |
| No | 5 (5.2%) | 81 (84.40%) | 13 (13.4%) | ||
| Odds ratio | 95% CI | |
|---|---|---|
| ***P < 0.01, **P < 0.05, *P < 0.10. WAZ: weight-for-age z-score; PTH: parathyroid hormone; CI: confidence interval. | ||
| Age group (0 - 23 months = 0 and 24 - 59 months = 1) | 22.05*** | 4.12 - 118.02 |
| Gender (male = 1, female = 0) | 0.22** | 0.06 - 0.90 |
| Weight for age z-score (WAZ) on admission | 1.77* | 0.98 - 3.20 |
| Exclusive breastfeeding (yes = 1, no = 0) | 2.11 | 0.52 - 8.58 |
| Dehydration (yes = 1, no = 0) | 1.09 | 0.26 - 4.50 |
| Bilateral pitting edema (yes = 1, no = 0) | 0.44 | 0.07 - 2.64 |
| Micronutrient deficiency (yes = 1, no = 0) | 3.06 | 0.72 - 12.99 |
| Potassium profile (hypo = 1, normal = 0) | 6.67** | 1.18 - 37.88 |
| Sodium profile (hypo = 1, normal = 0) | 3.60* | 0.85 - 15.21 |
| Calcium profile (hypo = 1, normal = 0) | 0.36 | 0.10 - 1.34 |
| Vitamin D (deficient = 1, normal = 0) | 0.71 | 0.22 - 2.28 |
| PTH profile (hypo = 1, normal = 0) | 0.15 | 0.02 - 1.42 |
| Anemia (yes = 1, no = 0) | 4.19* | 0.86 - 20.40 |
| Constant | 0.62 | |