Figures
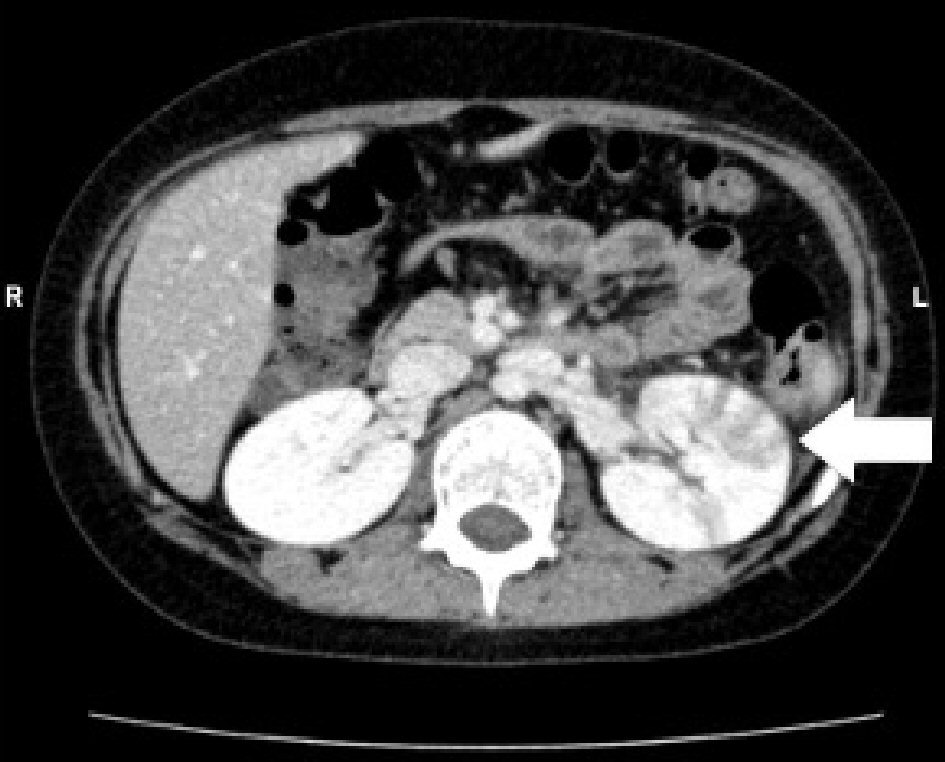
Figure 1. Abdominal enhanced computed tomography (CT) shows enlargement of the left kidney, with multiple wedge-shaped defects (arrow).
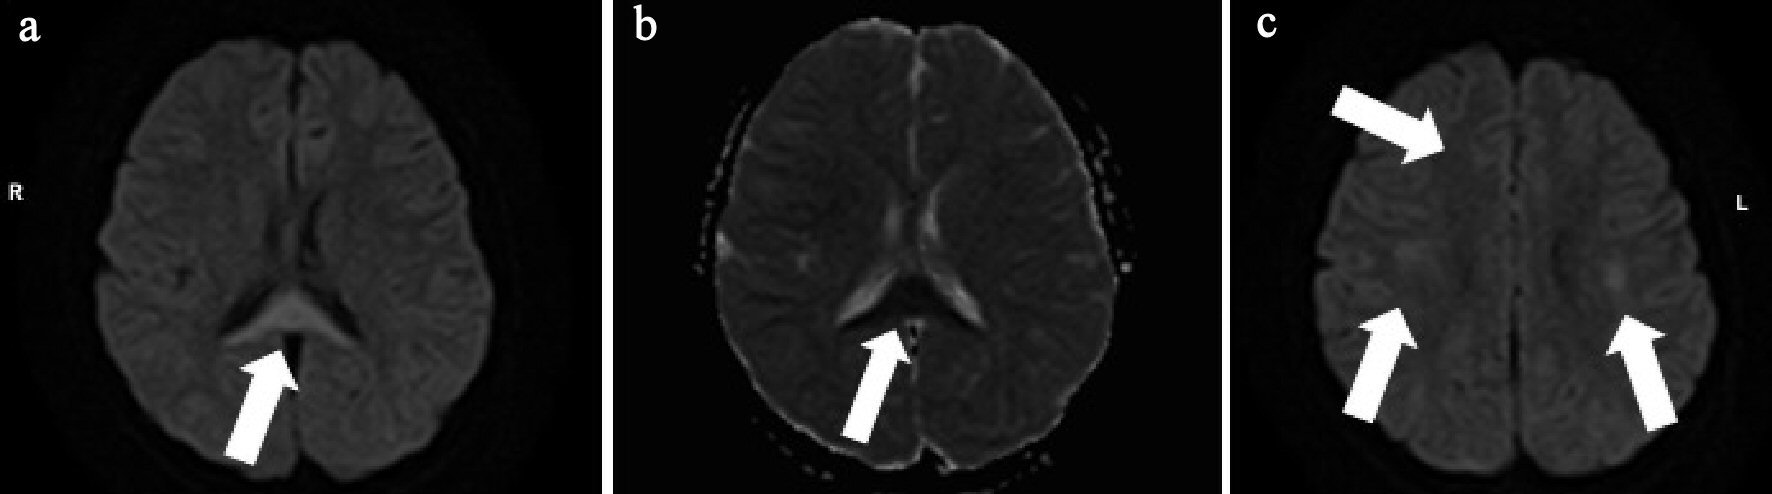
Figure 2. (a) Brain diffusion-weighted (DW)-MRI shows focal, high-intensity lesion in the splenium of the corpus callosum (arrow). (b) Apparent diffusion coefficient (ADC) mapping shows decreased ADC values at the region of the abnormality (arrow). (c) DW-MRI shows bilateral symmetrical high intensity white matter lesions at the frontal and parietal lobes (arrows).
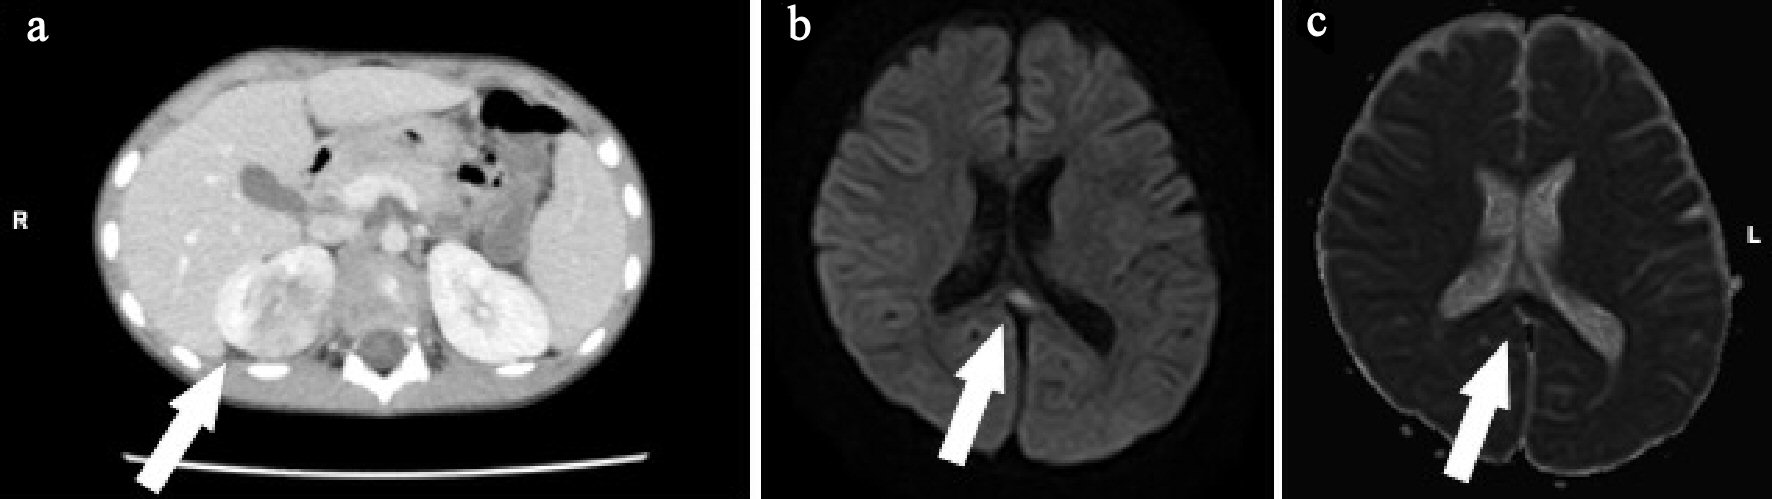
Figure 3. (a) Abdominal enhanced computed tomography (CT) shows right kidney with multiple wedge-shaped defects (arrow). (b) Brain diffusion-weighted magnetic resonance imaging (DW-MRI) shows a focal, high-intensity lesion in the splenium of the corpus callosum (arrow). (c) Apparent diffusion coefficient (ADC) mapping shows decreased ADC values at the region of the abnormality (arrows).
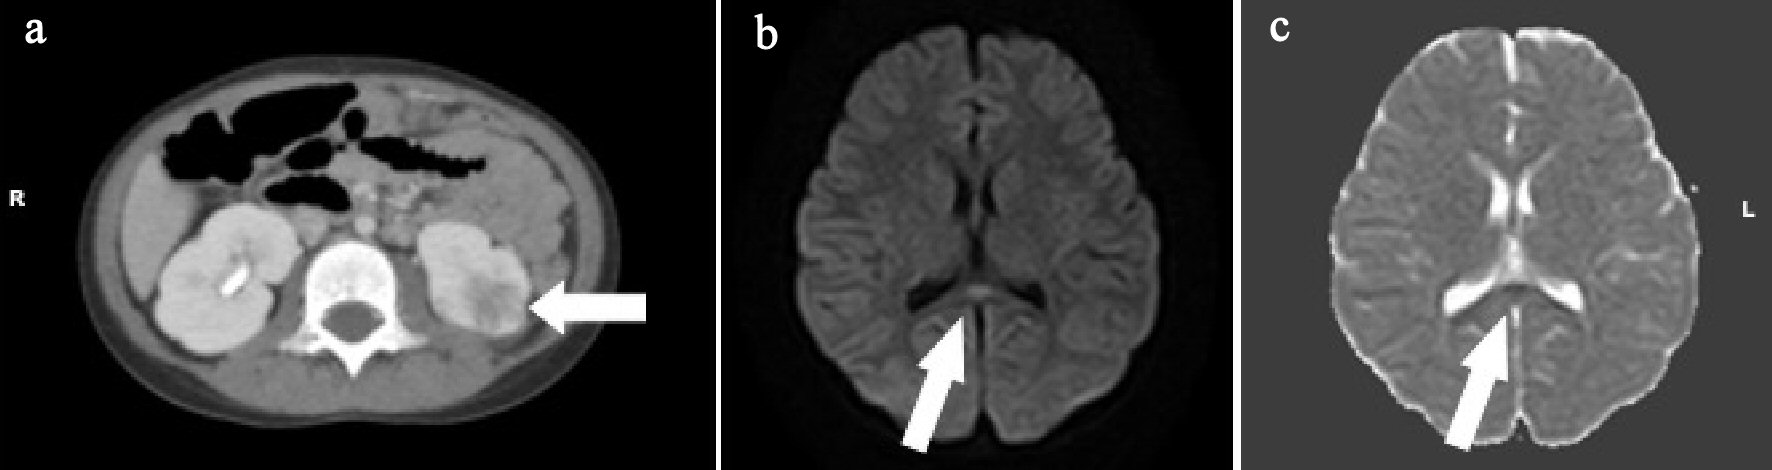
Figure 4. (a) Abdominal enhanced computed tomography (CT) shows the left kidney with multiple wedge-shaped defects (arrow). (b) Brain diffusion-weighted magnetic resonance imaging (DW-MRI) shows a focal, high-intensity lesion in the splenium of the corpus callosum (arrow). (c) Apparent diffusion coefficient (ADC) mapping shows decreased ADC values at the region of the abnormality (arrows).