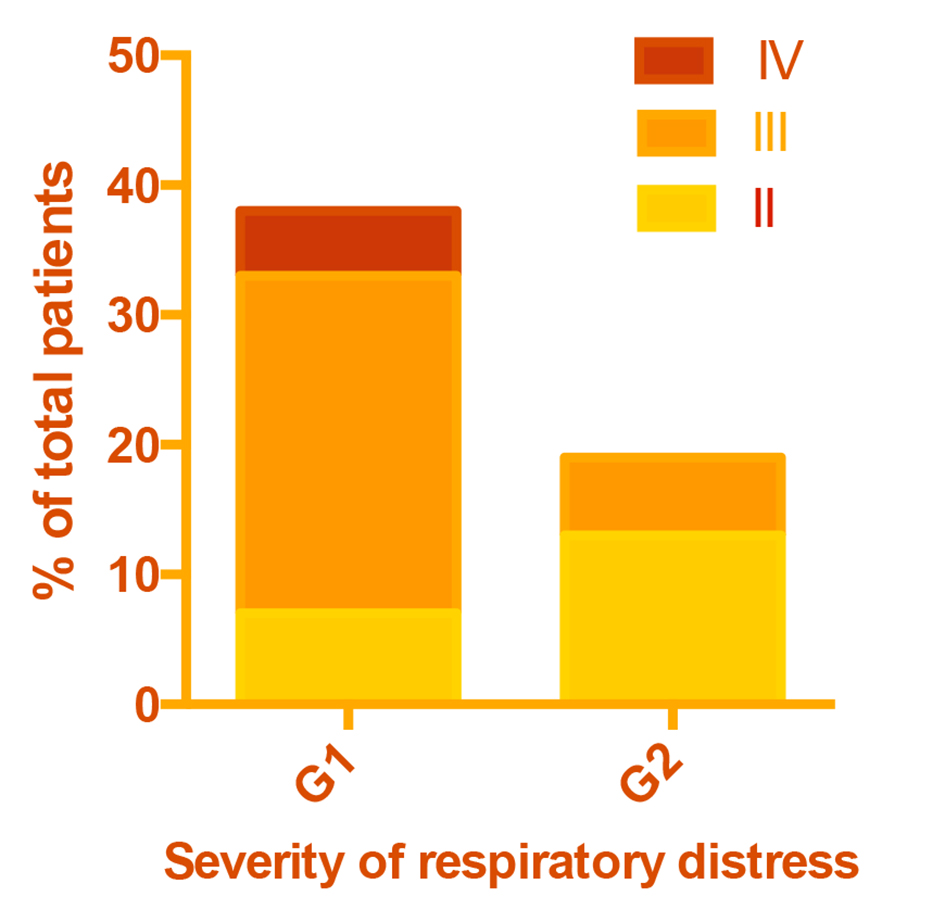
Figure 1. Severity of respiratory distress in patient groups.
| International Journal of Clinical Pediatrics, ISSN 1927-1255 print, 1927-1263 online, Open Access |
| Article copyright, the authors; Journal compilation copyright, Int J Clin Pediatr and Elmer Press Inc |
| Journal website http://www.theijcp.org |
Original Article
Volume 5, Number 2, June 2016, pages 19-28
Clinical Presentation of Malnourished Patients With Pneumonia Requiring Prolonged Ventilatory Support
Figures
Tables
| G1 (N = 38) | G2 (N = 19) | C (N = 18) | |
|---|---|---|---|
| †Difference between G1 and G2 significant at alpha = 0.05. *Difference between G1 and C significant at alpha = 0.05. ¶Difference between G2 and C significant at alpha = 0.05. §One missing observation. Values are mean ± SD, number of subjects with percent in parentheses. | |||
| Age (months)*¶ | 9.6 ± 10.9 | 5.2 ± 4.6 | 17.1 ± 9.6 |
| Weight (kg)*¶ | 6.2 ± 3.4 | 5.8 ± 2.1 | 9.9 ± 2.3 |
| Height/length (cm)*¶ | 63.5 ± 11.6 | 60.2 ± 9.1 | 77.4 ± 9.0 |
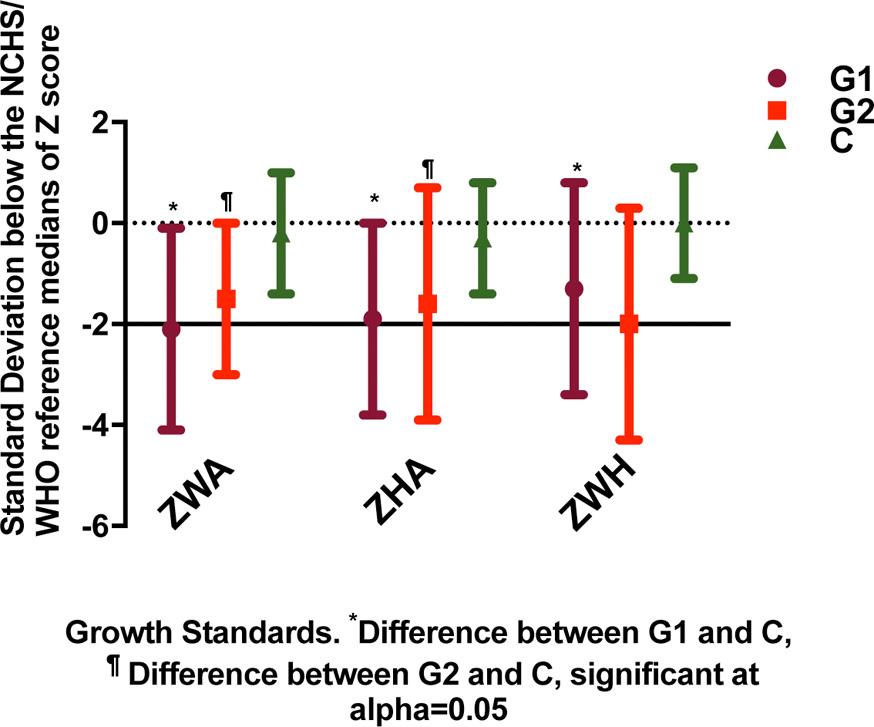
| ZWA*¶ | -2.1 ± 2.0 | -1.5 ± 1.5 | -0.2 ± 1.2 |
| ZHA* | -1.9 ± 1.9 | -1.6 ± 2.3 | -0.3 ± 1.1 |
| ZWH* | -1.3 ± 2.1 | -0.2 ± 2.3 | -0.0 ± 1.1 |
| Male gender | 21 (55.3) | 9 (47.4) | 7 (38.9) |
| Low birth weight | 7 (18.4) | 2 (10.5) | 0 (0.0) |
| Feeding practice after birth: breastfed (± supplementation)* | 23 (60.5) | 16 (84.2) | 18 (100.0) |
| Formula only | 15 (39.5) | 3 (15.8) | 0 (0.0) |
| Previously hospitalized | 8 (21.1) | 2 (10.5) | |
| First episode | 26 (68.4) | 15 (78.9) | |
| Recurrent infection | 12 (31.6) | 4 (21.1) | |
| Severity of RD† | |||
| II | 7 (18.4) | 13 (68.4) | |
| III | 26 (68.4) | 6 (31.6) | |
| IV | 5 (13.2) | 0 | |
| Route of feeding† | § | ||
| IV | 14 (36.8) | 9 (50.0) | |
| NG | 1 (2.6) | 8 (44.4) | |
| Both | 23 (60.5) | 1 (5.6) | |
| Vomiting† | 6 (15.8) | 9 (47.4) | |
| Diarrhea | 5 (13.2) | 7 (36.8) | |
| Fever | 34 (89.5) | 14 (73.7) | |
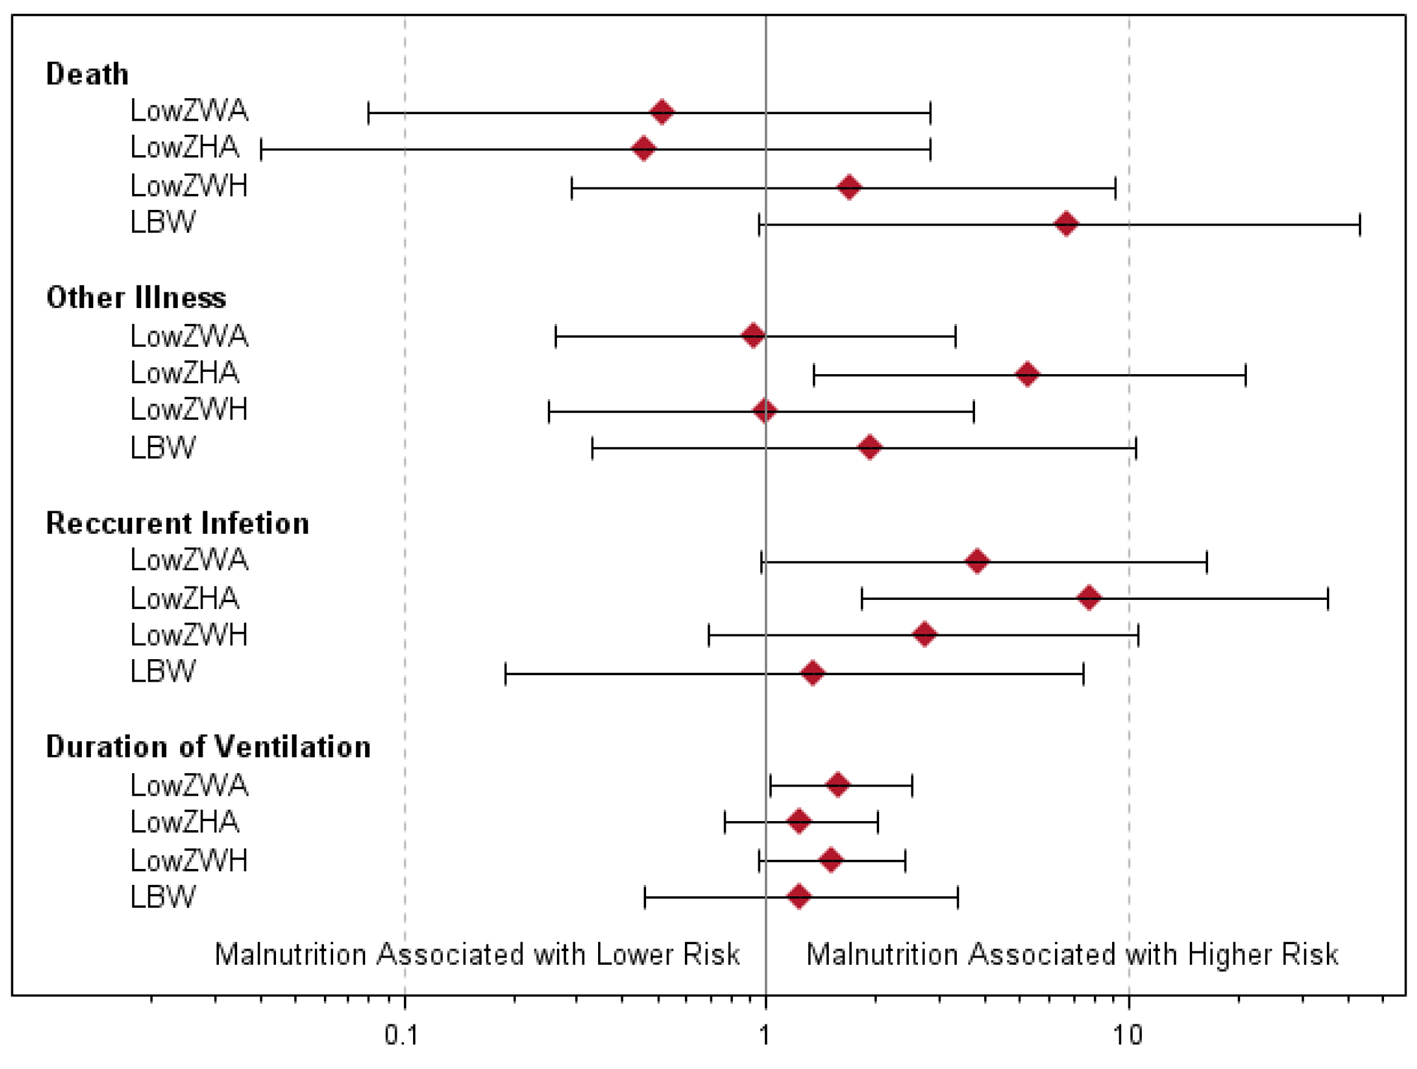
| Died* | Other illness | Recurrent infection | Duration of ventilation (h)** | |
|---|---|---|---|---|
| *Death status is missing for one patient, so only 56 patients are included. **Duration of ventilation is reported as geometric means with 95% confidence intervals within groups, comparison between groups by ratio of geometric means. ***Statistically significant associations. | ||||
| Low weight for age | ||||
| Yes | 3/26 (12%) | 8/26 (31%) | 11/26 (42%)*** | 143 (97 - 211)*** |
| No | 6/30 (20%) | 10/31 (32%) | 5/31 (16%)*** | 90 (68 - 119)*** |
| OR (95% CI) | 0.52 (0.08 - 2.83) | 0.93 (0.26 - 3.30) | 3.81 (0.97 - 16.47) *** | 1.59 (1.02 - 2.50)*** |
| Exact P-value | 0.48 | 1.00 | 0.040*** | 0.043*** |
| Low height for age | ||||
| Yes | 2/20 (10%) | 11/20 (55%)*** | 11/20 (55%)*** | 126 (81 - 197) |
| No | 7/36 (19%) | 7/37 (19%)*** | 5/37 (14%)*** | 102 (77 - 235) |
| OR (95% CI) | 0.46 (0.04 - 2.83) | 5.24 (1.35 - 20.82) *** | 7.82 (1.84 - 35.47)*** | 1.24 (0.77 - 2.01) |
| Exact P-value | 0.47 | 0.0077*** | 0.0016*** | 0.37 |
| Low weight for height | ||||
| Yes | 4/19 (21%) | 6/19 (32%) | 8/19 (42%) | 142 (91- 222) |
| No | 5/37 (14%) | 12/38 (32%) | 8/38 (21%) | 94 (72 - 123) |
| OR (95% CI) | 1.71 (0.29 - 9.17) | 1.00 (0.25 - 3.74) | 2.73 (0.69-10.62) | 1.51 (0.95 - 2.40) |
| Exact P-value | 0.47 | 1.00 | 0.12 | 0.08 |
| Low birth weight | ||||
| Yes | 4/9 (44%)*** | 4/9 (44%) | 3/9 (33%) | 132 (49 - 356) |
| No | 5/47 (11%)*** | 14/48 (29%) | 13/48 (27%) | 107 (85 - 134) |
| OR (95% CI) | 6.72 (0.95 - 43.48)*** | 1.94 (0.33 - 10.46) | 1.35 (0.19 - 7.46) | 1.24 (0.67 - 2.27) |
| Exact P-value | 0.029*** | 0.44 | 0.7 | 0.63 |
| G1 | G2 | |||
|---|---|---|---|---|
| Mean (95% CI) | SD | Mean (95% CI) | SD | |
| †Significant difference between G1 and G2 at alpha = 0.05. | ||||
| HCO3† | 28.9 (25.7 - 32.0) | 6.4 | 19.6 (16.9 - 22.4) | 5.4 |
| FIO2 | 51.5 (41.2 - 61.7) | 14.8 | ||
| PaO2 | 73.1 (53.0 - 93.1) | 40.8 | 61.4 (49.6 - 73.1) | 22.9 |
| PaO2/FIO2 | 184.7 (102.1 - 267.3) | 125.5 | ||
| PaCO2† | 44.3 (38.7 - 49.9) | 11.2 | 31.2 (26.7 - 35.7) | 8.8 |