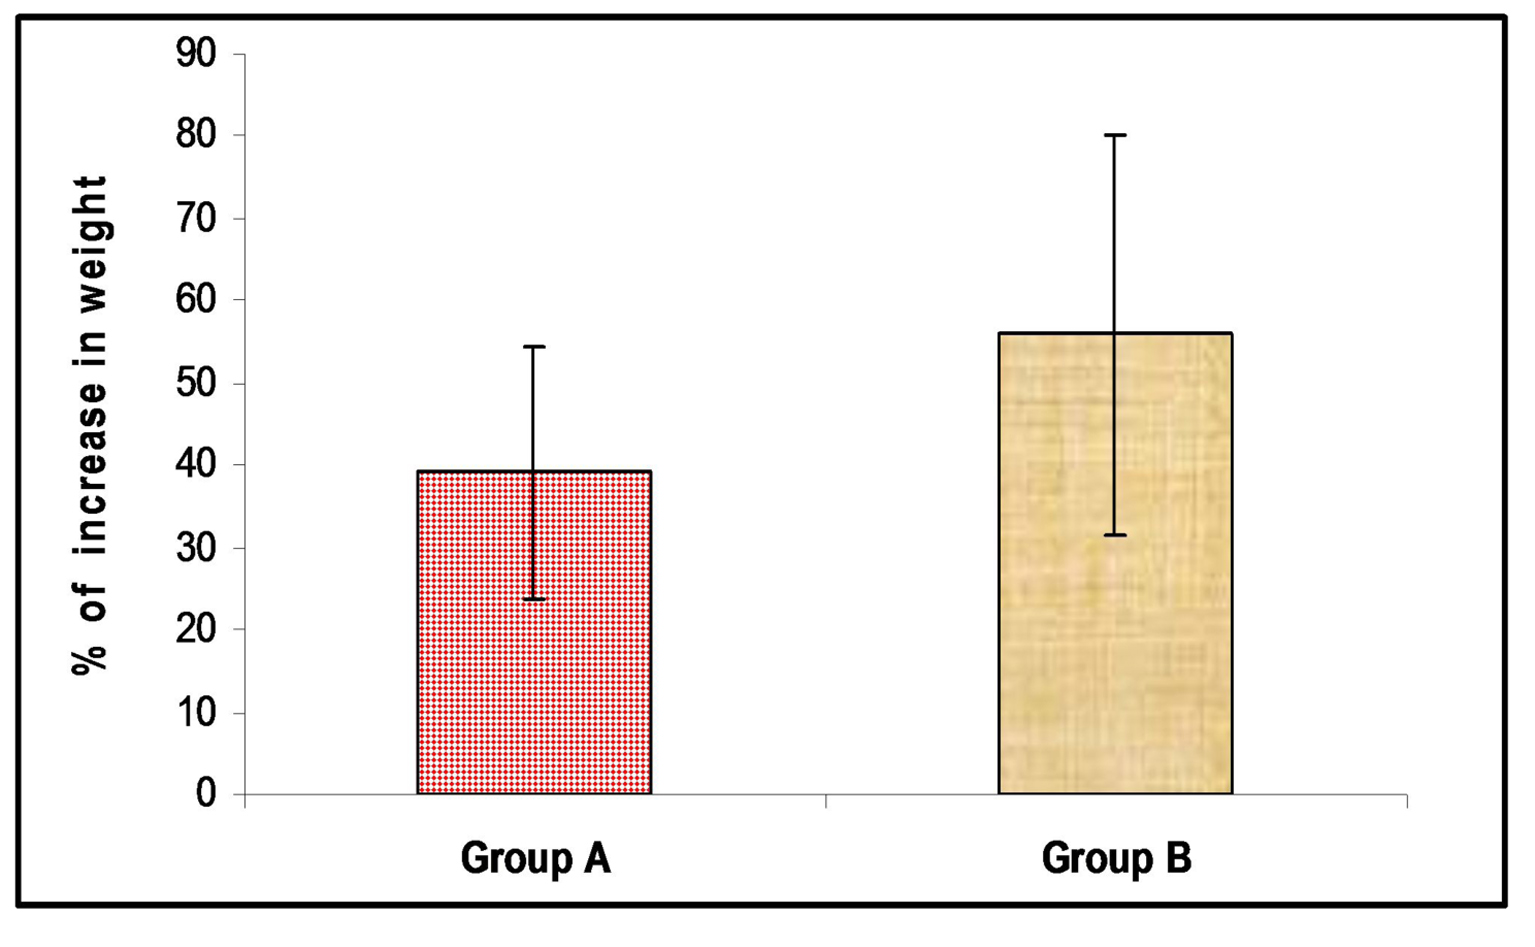
Figure 1. Comparison between the percentage of the change in weight in the two groups during NICU stay, P < 0.01. P* < 0.05 is significant, P** < 0.01 is highly significant and P < 0.001 is very highly significant.
| International Journal of Clinical Pediatrics, ISSN 1927-1255 print, 1927-1263 online, Open Access |
| Article copyright, the authors; Journal compilation copyright, Int J Clin Pediatr and Elmer Press Inc |
| Journal website http://www.theijcp.org |
Original Article
Volume 3, Number 2, June 2014, pages 40-45
Effect of Implementing Breastfeeding Promotion Program in Neonatal Intensive Care Unit on Newborn Weight and Breastfeeding Practices
Figures


Tables
| Group A | Group B | Total | Chi-square | ||||||
|---|---|---|---|---|---|---|---|---|---|
| N | % | N | % | N | % | X2 | P-value | ||
| PPROM: preterm pre-mature rupture of membrane; SPET: severe pre-eclamptic toxemia; IUGR: intra-uterine growth retardation; ITP: idiopathic thrombocytopenic purpura; MOD: mode of delivery; LSCS: lower segment caesarian section; SVD: spontaneous vaginal delivery. | |||||||||
| Parity | 0 | 10 | 47.62 | 11 | 52.38 | 21 | 45.65 | 1.099 | 0.777 |
| 1 | 4 | 57.14 | 3 | 42.86 | 7 | 15.22 | |||
| 2 | 6 | 60.00 | 4 | 40.00 | 10 | 21.74 | |||
| 3 | 3 | 37.50 | 5 | 62.50 | 8 | 17.39 | |||
| Risk factors for preterm birth | PPROM | 7 | 53.85 | 6 | 46.15 | 13 | 28.26 | 10.676 | 0.058 |
| SPET | 8 | 53.33 | 7 | 46.67 | 15 | 32.61 | |||
| IUGR | 0 | 0.00 | 3 | 100.00 | 3 | 6.52 | |||
| Twines | 7 | 63.64 | 4 | 36.36 | 11 | 23.91 | |||
| Chronic ITP | 1 | 100.00 | 0 | 0.00 | 1 | 2.17 | |||
| PPROM | 0 | 0.00 | 3 | 100.00 | 3 | 6.52 | |||
| MOD | LSCS | 17 | 43.59 | 22 | 56.41 | 39 | 84.78 | 4.605 | 0.032 |
| SVD | 6 | 85.71 | 1 | 14.29 | 7 | 2 | |||
| Group A | Group B | P-value | ||
|---|---|---|---|---|
| GA: gestational age; wk: week. | ||||
| GA, mean (SD) (wk) | Range | 23.00 - 35.00 | 28.00 - 39.00 | 0.30 |
| Mean ± SD | 30.39 ± 2.35 | 32.04 ± 2.65 | ||
| Ballard score (wk) | Range | 30.00 - 35.00 | 30.00 - 35.00 | 0.18 |
| Mean ± SD | 32.04 ± 1.52 | 32.65 ± 1.53 | ||
| Sex | Female | 14 (60.87%) | 12 (52.17%) | 0.552 |
| Male | 9 (39.13%) | 11 (47.83%) | ||
| Group A | Group B | P-value | |
|---|---|---|---|
| Mean ± SD | Mean ± SD | ||
| Weight at admission/g | 1,260 ± 130 | 1,240 ± 190 | 0.71 |
| Weight at discharge/g | 1,760 ± 110 | 1,850 ± 150 | 0.02 |
| Percent increase in infant weight | 39.08 ± 15.43 | 55.94 ± 24.27 | < 0.01 |
| Number of mother visits/day | 1.3 ± 0.62 | 6.05 ± 1.62 | < 0.001 |
| Breast-milk volume/day | 40.36 ± 28.9 | 111.63 ± 28.64 | < 0.01 |
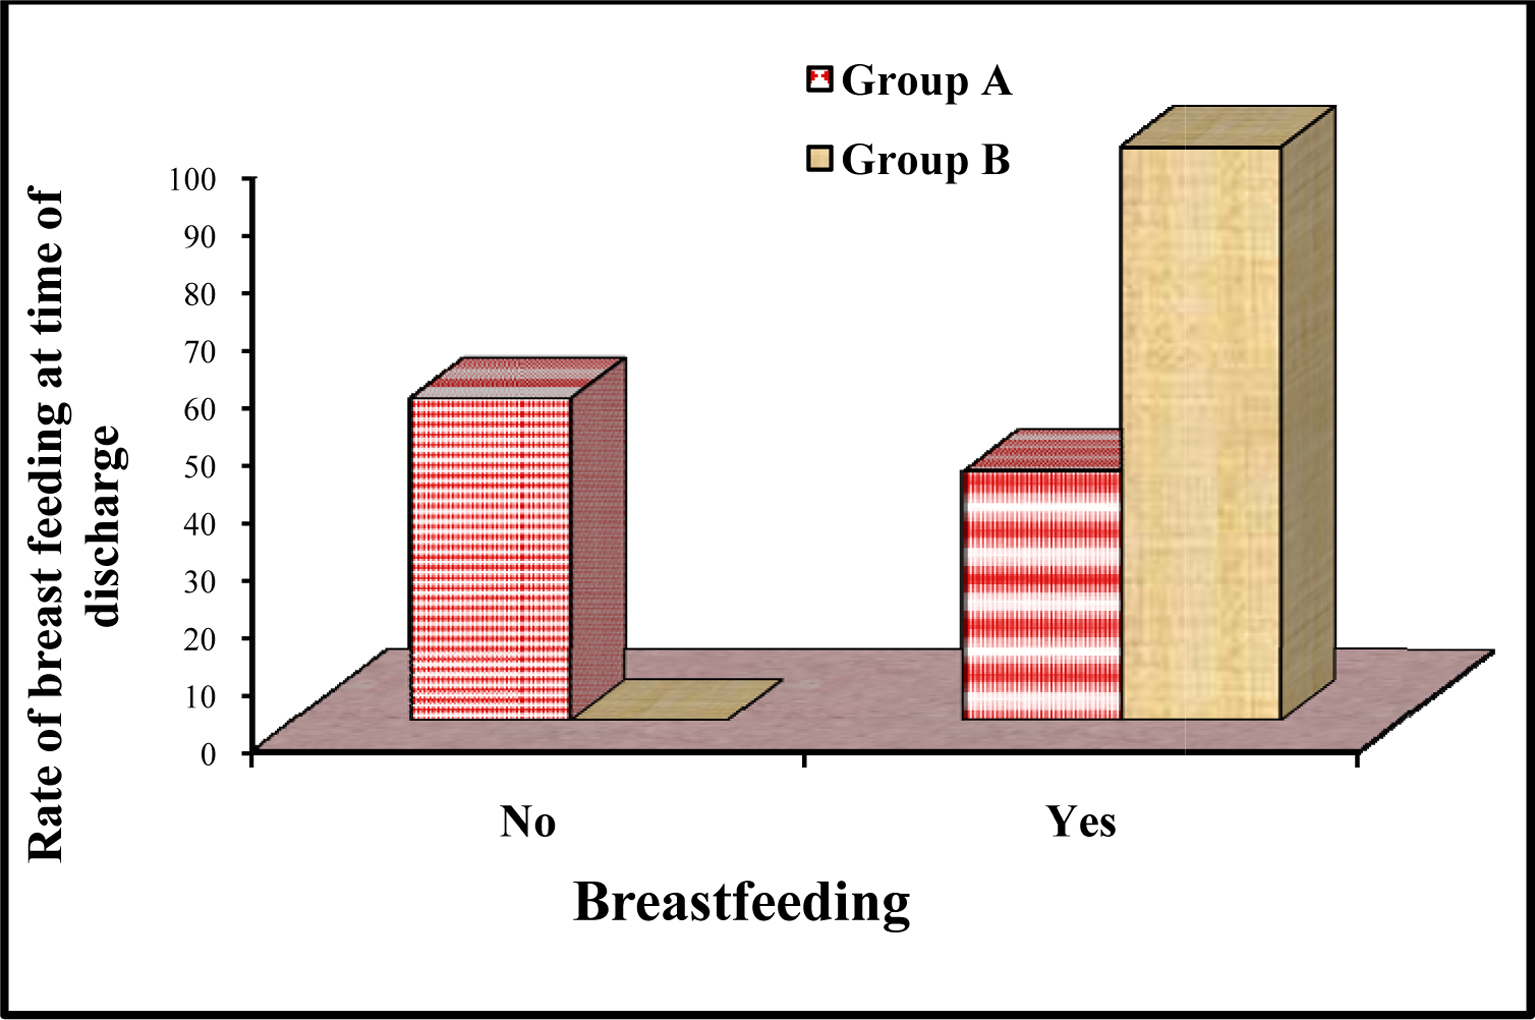
| Percent of breastfeeding at time of discharge | 43.48 | 100 | < 0.0001 |